In general, libraries are considered as inclusive institutions, where all users expect to receive the same level of service regardless of personal characteristics such as age, gender, marital status, race, religion, sexual orientation or social class.
Indeed statistics presented in Taking part focus on: diversity published by the UK’s Department for Media, Culture and Sport show that public libraries compare favourably with other arts, cultural and heritage sector organisations. For example, they engage proportionately more of the black and minority ethnic adult population than they do white adults (p.4), and equally with all members of the population whether or not they have a long standing illness or disability (p.5). In addition, the difference evident in public libraries’ levels of engagement between different socio-economic groups is the narrowest in the sector (p.6), and, unlike other arts, cultural and heritage organisations, the greater proportion of library users comprises lower (as opposed to higher) income groups (p.7). The figures presented in the report thus show how UK public libraries promote inclusivity by serving the most diverse set of audiences in the sector.
However, when libraries are regarded as workplaces, the position is not so encouraging. While undertaking the Workforce Mapping Project (commissioned by CILIP and ARA in 2014/15) my team within the Centre for Social Informatics, along with colleagues in the Employment Research Institute, at Edinburgh Napier University uncovered some important findings on the diversity of the UK’s information workforce.
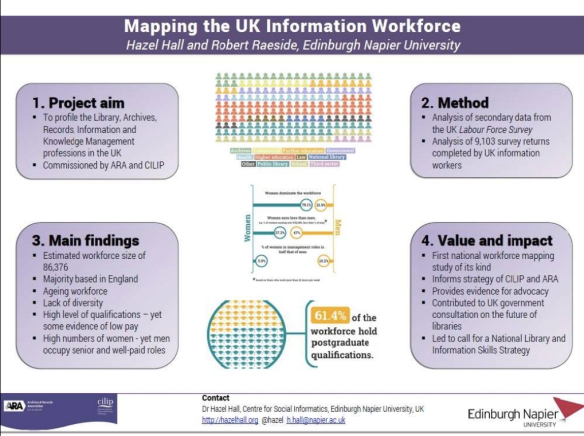
- First, it has low ethnic diversity. 96.7% of its membership identify as ‘white’. This figure is higher than that of the general working population: 87.5% identify as ‘white’ in UK Labour Force Survey statistics.
- Gender is also an issue. The overall gender split of the workforce is 78.1% female, 21.9% male. This contrasts with the gender split of the UK workforce as a whole, which is 50.1% female, 49.9% male.
- Men in the sector earn more than women. For example, whereas 47% of male workers earn £30,000 or more annually, the equivalent figure for female workers is 37.3%.
- Male workers are more likely to occupy management roles than their female peers. The 10.2% of men in senior management roles is almost double that of women at 5.9%.
- The highest proportion of the workforce falls in the 45 to 55 age band. 55.3% are over 45 years of age. Given that the equivalent figure for the UK workforce as a whole is 41.1%, these findings indicate an ageing workforce population.
In March CILIP announced in a blog post entitled Championing diversity and equalities in all our work that it will soon be launching a Diversity and Equalities Action Plan. This will address the diversity and gender disparities in the library and information profession considered ‘deeply concerning’ and ‘unacceptable’ by the professional body. The plan will have three priorities: (1) to make CILIP as an exemplar of best practice; (2) to promote positive change in today’s profession; and (3) to build an open, inclusive profession for the future. Further detail of these plans can be found on the CILIP web site.
The Edinburgh Napier team that undertook the Workforce Mapping Project is pleased to count the development of the CILIP Diversity and Equalities Action Plan as one of the impacts of the work completed in 2015.
Other impacts include the 2015 call for a National Library and Information Skills Strategy to address the gender pay gap and lack of diversity in the information professions, and the use of the project findings as evidence in a UK government consultation report on the future of libraries. An approach from a library and information science professional body in another geography keen to replicate elements of this work is also regarded as a further indicator of future possible impact of this work in that it helps spread good practice in research design for workforce mapping studies of this nature.
To find out more about the Workforce Mapping Project, please see the executive summary published in 2015, and the contribution to the Annual meeting of the Association for Information Science and Technology in Copenhagen in October 2016 – an overview is presented in the graphic below. Factsheets that provide data from the study according to region and sector are also available for download from the CILIP web site.

